

BUILD AND MARKET YOUR SHOPIFY STORE
We help e-commerce brands maximise growth opportunities


LTV Calculator: Customer Lifetime Value Formula and Example
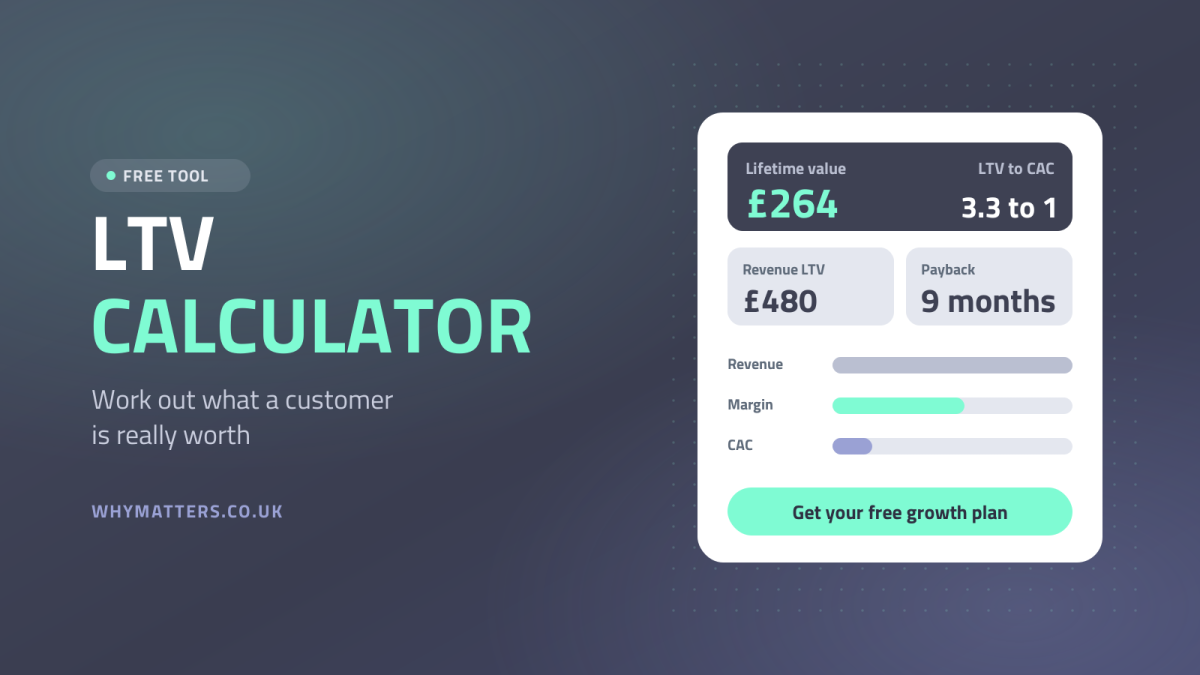
Enter what a typical customer spends per order, how often they buy, how long they stay and what it costs to win them. The calculator returns lifetime value on revenue and on margin, the LTV to CAC ratio, how many months the acquisition cost takes to pay back and the most you can afford to pay for a new customer. Everything runs in your browser and nothing you type is stored.
Free customer lifetime value calculator
£
months
%
£
to 1
Use average figures for one type of customer at a time (all customers, subscribers, or one channel) and revenue excluding VAT. Gross margin is what is left after product cost; use contribution margin instead if you also want delivery, fees and returns taken off. CAC is ad spend plus sales costs divided by new customers won.
Lifetime value on margin£264
Lifetime value on revenue£480
LTV to CAC (on margin)3.3 to 1
CAC paid back after9 months
Lifetime value on revenue is average order value times orders a year times years a customer keeps buying. Lifetime value on margin multiplies that by gross margin, and it is the figure to set acquisition budgets against. Payback is CAC divided by the margin a customer produces each month.
Key Takeaways
- The LTV formula is average order value × orders per customer a year × years a customer keeps buying. £48 × 4 × 2.5 is a lifetime value of £480 on revenue.
- Multiply by gross margin before setting budgets. At 55% the same customer is worth £264, and only that £264 can pay for advertising, offers and overheads.
- Shopify's guide puts a good LTV to CAC ratio at around 3 to 1. On margin, the example customer costing £80 to acquire returns 3.3 to 1 and pays back in about nine months.
- Lifetime value lets you accept a first order that loses money. At a 3 to 1 target the example store can pay £88 per new customer, a first order ROAS of just 0.55x on a £48 order.
- Small changes compound: one more order a year adds £66 of margin per customer, six more months adds about £53, and together with a £5 higher order value and five points of margin the figure rises from £264 to £477.
- After we optimised one coffee brand client's store this year, its average customer lifetime value rose from £25 to £35 within two months, a 40% increase.
Quick Answer
An LTV calculator multiplies average order value by orders per customer a year and by the years a customer keeps buying to give lifetime value on revenue, then multiplies that by gross margin to give the lifetime value that can actually pay for acquisition. Dividing the margin figure by customer acquisition cost gives the LTV to CAC ratio, which Shopify's guide says should sit around 3 to 1, and dividing acquisition cost by the margin a customer produces each month gives the payback period. The calculator at the top of this page does all of that from five figures, and the rest of the page shows where each number comes from and how to move it.
Table of Contents
- How to Use the LTV Calculator
- What the Results Mean
- The LTV Formula and a Worked Example
- LTV to CAC, Payback and the First Order
- What Moves Lifetime Value Most
- Where to Find the Numbers in Shopify and Klaviyo
- Why Matters Perspective
- Frequently Asked Questions
- Final Thoughts
- Related Articles
How to Use the LTV Calculator
Work with averages for one kind of customer at a time. All customers blended together is a fine start, but subscribers, one time buyers and customers from different channels have very different values, and the useful decisions come from comparing them.
- Average order value is revenue per order excluding VAT. Shopify's customer reports show total spent including taxes, discounts, shipping and refunds, so strip VAT and delivery out before dividing by orders.
- Orders per customer a year is total orders in a year divided by the customers who placed them. A store where most people buy once will sit near 1.2, a consumables brand nearer 4 or more.
- How long a customer keeps buying, in months, is the gap between a customer's first and last order, averaged across customers who have stopped. If your store is young, Shopify suggests a conservative assumption from early patterns, such as 12 months when most repeat buyers return within six, and refining it as data builds.
- Gross margin is what is left of an order after product cost. Use contribution margin instead if you want delivery, packaging, payment fees and returns taken off as well, which gives a stricter, safer figure.
- Cost to acquire a customer follows Shopify's definition: total ad spend plus sales expenses, divided by new customers acquired in the period. Spending £8,000 to win 100 new customers is a CAC of £80.
- Target LTV to CAC ratio defaults to 3 to 1. Lower it if your overheads are light, raise it if you want acquisition to fund itself quickly.
What the Results Mean
The dark panel turns those inputs into six answers. The table shows how each is worked out, using the worked example from the next section.
| Result | How it is calculated | Example |
|---|---|---|
| Lifetime value on revenue | Order value × orders a year × years | £48 × 4 × 2.5 = £480 |
| Lifetime value on margin | Revenue LTV × gross margin | £480 × 55% = £264 |
| LTV to CAC | Margin LTV ÷ acquisition cost | £264 ÷ £80 = 3.3 to 1 |
| CAC paid back after | CAC ÷ margin per customer per month | £80 ÷ £8.80 = 9 months |
| Most you can pay per customer | Margin LTV at break even, or margin LTV ÷ target ratio | £264, or £88 at 3 to 1 |
| First order ROAS you can accept | Order value ÷ most you can pay | £48 ÷ £88 = 0.55x |
The bars put revenue, margin and acquisition cost side by side so the gap is obvious. If the margin bar is shorter than the CAC bar, every new customer loses money over their whole lifetime, not just on the first order, and the verdict says by how much.
The LTV Formula and a Worked Example
Take a store whose typical customer spends £48 an order excluding VAT, buys four times a year and keeps buying for 2.5 years. Four orders at £48 is £192 a year, and 2.5 years of that is £480: the lifetime value on revenue. The store keeps 55% of each order after product cost, so the lifetime value on margin is £480 × 55% = £264. That is the figure that matters, because revenue cannot pay for advertising.
Winning that customer cost £80, so the LTV to CAC ratio on margin is £264 ÷ £80, which is 3.3 to 1, and £184 of margin is left for overheads and profit. The same ratio on revenue would be 6 to 1, which looks twice as good and means nothing on its own. Our customer lifetime value guide works through the same example in more depth, including refunds, discounts and the stricter contribution version.
LTV to CAC, Payback and the First Order
Shopify's LTV to CAC guide puts a good ratio at around 3 to 1, with ecommerce brands often between 2 to 1 and 4 to 1. It treats 2 to 1 or less as close to break even, and a very high ratio as a sign of underinvestment in acquisition. Two cautions: the guide bases lifetime value on revenue, so apply the benchmark to the margin figure if you want it to mean profit, and a ratio says nothing about timing.
Timing is the payback period. The example customer produces £8.80 of margin a month (£192 a year × 55% ÷ 12), so the £80 spent to win them comes back in about nine months. A store with a 3 to 1 ratio and a 20 month payback can still run out of cash while it waits, which is why both numbers sit next to each other on the panel.
Lifetime value also changes what a good first order looks like. At a 3 to 1 target the example store can pay up to £88 for a new customer. On a £48 first order that is a return on ad spend of 0.55x, far below the 1.82x the store needs to break even on a single order at a 55% margin. If the repeat purchases really happen, a campaign that looks loss making on first order ROAS is paying handsomely. Use the ROAS calculator for the single order view and this one for the lifetime view, and never confuse the two.
What Moves Lifetime Value Most
Because the formula multiplies its inputs, small improvements compound. The table changes one input at a time from the worked example and shows what each is worth per customer.
| Change | Margin LTV | Difference |
|---|---|---|
| Starting point | £264 | base |
| One more order a year (5) | £330 | +£66 |
| Six more months (36 months) | £316.80 | +£52.80 |
| Margin up five points (60%) | £288 | +£24 |
| Order value up £5 (£53) | £291.50 | +£27.50 |
| All four together | £477 | +£213 |
One extra order a year is the biggest single lever, which is why email flows, subscriptions and replenishment reminders matter so much, and the four changes together lift lifetime value by 81%. That is also the argument for measuring lifetime value by cohort: if customers won through one channel or one first product stay longer or buy more often, acquisition should follow them.
Where to Find the Numbers in Shopify and Klaviyo
Shopify's customer reports give customers over time, first time against returning customers, and each customer's total spent. The Customer cohort analysis report shows amount spent per customer by cohort and can project it forward once a store has 24 months of data, which is the quickest way to see lifespan and orders per customer for real. Predicted spend tier needs more than 100 sales before Shopify will group customers.
Klaviyo shows Historic, Predicted and Total CLV on each profile once an account has at least 500 customers with orders, 180 days of order history, orders in the last 30 days and some customers with three or more orders, according to Klaviyo's guide. Those predicted values are useful for segmenting, but check them against the simple formula before you set a budget on them. We are a Klaviyo partner.
Why Matters Perspective
Lifetime value is the number we most often find missing when a new client asks how much they can spend on ads. The answer depends entirely on what happens after the first order, and most stores already have the data to find out. After we optimised one coffee brand client's store this year, its average customer lifetime value rose from £25 to £35 within two months, a 40% increase, and Mama Bamboo, a nappy subscription brand we work with, cut churn by 23% and raised subscription lifetime value by 45%. Neither needed more traffic.
When we onboard subscription clients we usually find a strategy failure: too much time spent on acquisition and not enough on retention. The calculator makes the cost of that visible. Six more months of loyalty in the worked example is worth £53 per customer, and across a thousand customers that is £53,000 of margin from work that costs a fraction of the ad budget.
If you would like the numbers checked against your own store, the free growth plan below starts with your customer data rather than a pitch. We are a Shopify Select partner and a Klaviyo partner, our pricing is published, retainers start from £650 a month plus VAT, are billed one month in arrears and never tie you into a long contract.
Frequently Asked Questions
What is the LTV formula?
The simple lifetime value formula is average order value multiplied by orders per customer a year multiplied by the number of years a customer keeps buying. A customer spending £48 an order, four times a year, for 2.5 years has a lifetime value of £480 on revenue. Multiply by gross margin to get the figure that can actually pay for acquisition, which at 55% is £264.
How do I calculate customer lifetime value for an ecommerce store?
Take your average order value excluding VAT, the average number of orders a customer places a year and how many years a typical customer keeps buying, then multiply the three. Use averages for one kind of customer at a time, because subscribers, one time buyers and customers from different channels have very different values, and label whether the result is on revenue or on margin.
Should lifetime value be calculated on revenue or on margin?
Calculate both, but set budgets on margin. Shopify's guide bases lifetime value on gross revenue, which it calls the ecommerce standard, yet revenue cannot pay for advertising. In the worked example a £480 revenue lifetime value becomes £264 at a 55% gross margin, and only the £264 is available to cover the cost of winning the customer.
What is a good LTV to CAC ratio?
Shopify's guide puts a good LTV to CAC ratio at around 3 to 1, with ecommerce brands often between 2 to 1 and 4 to 1, and treats 2 to 1 or less as close to break even. Check the basis before you compare: a 3 to 1 ratio on revenue can be a loss once product costs come out, while 3 to 1 on margin leaves room for overheads and profit.
How do I work out customer acquisition cost?
Shopify's guide defines customer acquisition cost as total ad spend plus sales expenses, divided by the number of new customers acquired in the same period. Count new customers only, not every order, and include agency fees and creative costs if you want the full figure. Spending £8,000 to win 100 new customers is a CAC of £80.
What is the CAC payback period?
Payback is how long a customer takes to return their acquisition cost in margin. Divide CAC by the margin a customer produces each month. In the worked example a customer produces £8.80 of margin a month, so an £80 acquisition cost is paid back in about nine months. Shorter payback means cash comes back sooner and growth can be funded from sales rather than savings.
Is LTV the same as CLV?
Yes. LTV, lifetime value, and CLV, customer lifetime value, describe the same measure, the value a customer generates over the whole relationship with your store. Software companies tend to say LTV and retailers CLV. The only thing that changes the number is the basis, revenue or margin, and the period you measure over.
Final Thoughts
Lifetime value turns a one order business into a relationship business, but only when it is measured on margin, for one kind of customer at a time, and next to what that customer cost to win. The calculator gives you those numbers in seconds; the harder work is believing them enough to change the acquisition budget.
Run it for your subscribers and your one time buyers separately, then for each marketing channel. The differences are usually larger than any benchmark, and they are where the growth is.
If you want help finding the figures in Shopify or Klaviyo, send them through the form below or email info@whymatters.co.uk and we will reply within 24 hours.
Related Articles
- Customer Lifetime Value for Shopify Stores: How to Calculate and Grow It
- ROAS Calculator: Find Your Break Even and Target ROAS
- What Is a Good ROAS for Ecommerce? Find Your Break Even
- Google Ads for Subscription Brands: Bid on Lifetime Value
- Shopify Subscription Metrics Every Merchant Should Track
- How to Get Shopify Repeat Customers: A Practical Implementation Guide
- Klaviyo Flows Every Shopify Subscription Brand Should Build
- How to Benchmark Your Shopify Email Revenue

Ayo is the founder of Why Matters and Head of Marketing. With over 20 years of experience in ecommerce, digital marketing and commercial growth, he has helped hundreds of Shopify brands build, launch and scale their online stores. Why Matters, a Shopify agency based in Brighton, is a Shopify Select partner and a Klaviyo, Recharge, Awin, Meta and TikTok partner.About AyoConnect on LinkedIn
Get your free growth plan
Tell us a little about your store and we'll get back to you within 24 hours.