

BUILD AND MARKET YOUR SHOPIFY STORE
We help e-commerce brands maximise growth opportunities


ROAS Calculator: Find Your Break Even and Target ROAS
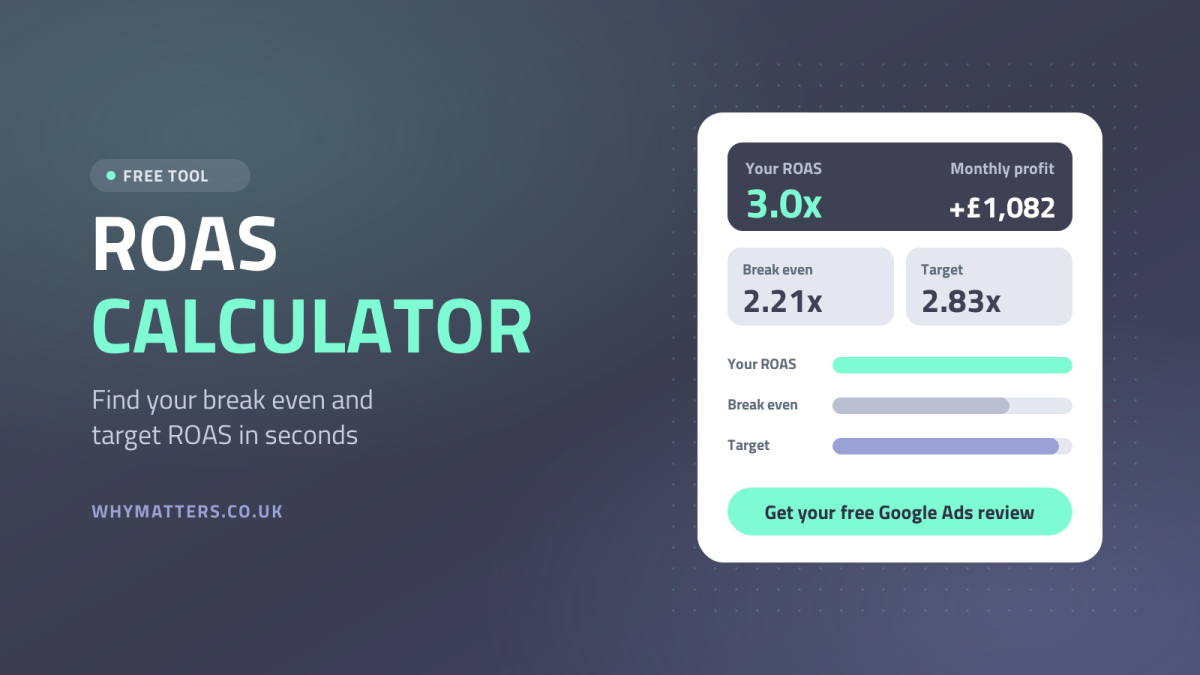
Enter your ad spend, the revenue it produced and what a typical order costs you to fulfil. The calculator shows your ROAS, the break even ROAS your store needs just to cover its costs, and the target ROAS that keeps the margin you want after advertising. Everything is worked out in your browser and nothing you type is stored.
Free ROAS and break even calculator
£
£
£
£
£
%
%
Use the same period and attribution window for spend and revenue. Product cost is what the items in a typical order cost you. Add any fixed pence per transaction to the per order costs. Results are a guide, not advice.
Your ROAS3x
Break even ROAS2.21x
Target ROAS for a 10% net margin2.83x
Result after ads, per month£1,082 profit
Most you can spend on ads per order before losing money: £45.35. Orders from ads: 90.
Get your free Google Ads review →Break even ROAS is 1 divided by your contribution margin. Contribution margin is order value less product cost, delivery, packaging, returns and payment fees, divided by order value, all excluding VAT.
Key Takeaways
- ROAS is the revenue your ads produced divided by what you spent on them. £9,000 of revenue from £3,000 of ad spend is a ROAS of 3x, which Google Ads shows as 300%.
- Break even ROAS is 1 divided by your contribution margin. A store that keeps £45.35 of every £100 order after product cost, delivery, returns and payment fees breaks even at 2.21x.
- A target ROAS adds the profit you want to keep. Keeping £10 of that £100 order after ads lifts the target to 2.83x, so the gap between break even and target is where the business is made.
- Spend and revenue must be on the same basis. Google Ads usually reports revenue including VAT, so a 400% ROAS in Google is about 333% once the 20% VAT is removed.
- Across the accounts we manage, we work to a floor of at least 2x, and when we audit a new client's advertising, an average of 30% of spend is wasted.
- A ROAS below break even is a reason to fix tracking, waste and margins first, not to switch the ads off.
Quick Answer
A ROAS calculator divides the revenue your ads produced by what you spent on them, then compares the result with the ROAS your store needs to break even. Break even ROAS is 1 divided by your contribution margin, where contribution margin is what is left of an order after product cost, delivery, packaging, returns and payment fees, all excluding VAT. A store with a 45.35% contribution margin breaks even at 2.21x, and to keep a 10% net margin after ads it needs 2.83x. The calculator at the top of this page works all three figures out from your own numbers, and the rest of the page explains where each number comes from.
Table of Contents
- How to Use the ROAS Calculator
- What the Results Mean
- The ROAS Formula and a Worked Example
- Break Even and Target ROAS at Different Margins
- Put Spend and Revenue on the Same Basis
- What to Do If You Are Below Break Even
- Why Matters Perspective
- Frequently Asked Questions
- Final Thoughts
- Related Articles
How to Use the ROAS Calculator
The calculator needs seven figures. Use the same month for ad spend and revenue, and take every money figure excluding VAT unless the box under the form says otherwise.
- Monthly ad spend is the Cost column in Google Ads, or Amount spent in Meta Ads Manager, for the period you are judging. Enter it as the platform reports it, before any VAT shown on the invoice.
- Revenue from those ads is the conversion value the ad platform reports for the same period. If that figure includes VAT, tick the box and the calculator divides it by 1.2.
- Average order value comes from Shopify Analytics. Divide it by 1.2 if your prices include VAT. If the figure includes delivery charged to the customer, take that charge off the delivery cost below instead, so it is not counted twice.
- Product cost per order is what the items in a typical order cost you, including inbound shipping and duty. Shopify can hold a cost per item against each product, which makes this figure easy to keep current.
- Delivery, packaging and returns per order is what you pay carriers and for boxes and filler, less any delivery charge the customer pays, plus an allowance for the orders that come back.
- Payment fees is the percentage your gateway charges. Shopify Payments in the UK charges 2% plus 25p on Basic, 1.7% plus 25p on Grow and 1.5% plus 25p on Advanced for online card payments, so enter the percentage here and add the 25p to the per order costs.
- Net margin you want after ads is the share of order value you want left once the ads are paid for. 10% is a sensible starting point, and the Target ROAS result changes as you move it.
What the Results Mean
Each result on the dark panel answers a different question. The table shows how the calculator works each one out, with the worked example figures from the next section.
| Result | How it is calculated | Example |
|---|---|---|
| Your ROAS | Revenue divided by ad spend | £9,000 ÷ £3,000 = 3x |
| Break even ROAS | 1 divided by contribution margin | 1 ÷ 0.4535 = 2.21x |
| Target ROAS | 1 divided by (contribution margin less the net margin you want) | 1 ÷ 0.3535 = 2.83x |
| Result after ads | Revenue times contribution margin, less ad spend | £4,081.50 less £3,000 = £1,081.50 |
| Most you can spend per order | Contribution per order, which is the most an order can cost to win before it loses money | £45.35 |
| Orders from ads | Revenue divided by average order value | £9,000 ÷ £100 = 90 |
The bars under the headline figures put your ROAS next to break even and target, so the gap is visible at a glance. Green means you are above break even and the ads are paying for themselves; red means every order from ads is costing you money. The one line verdict then says how much the account is making or losing a month.
The ROAS Formula and a Worked Example
Take a product that sells for £120 including VAT. The standard rate of VAT is 20%, so the store keeps £100 of revenue. Out of that £100 go £40 of product cost, £7 of delivery and packaging, a £5 allowance for returns and a £2.65 payment fee. That leaves £45.35 of contribution, a contribution margin of 45.35%.
Break even ROAS is 1 divided by 0.4535, which is 2.21x. Put another way, every £1 of ad spend has to bring back £2.21 of ex VAT revenue before the ads have covered themselves. To keep £10 of profit on each £100 order, only £35.35 is left to spend winning it, so the target is £100 divided by £35.35, which is 2.83x.
Now run a month through it. With £3,000 of ad spend producing £9,000 of revenue, the ROAS is 3x and the ads brought 90 orders. Those orders produced 90 times £45.35, which is £4,081.50 of contribution, and after the £3,000 of spend the store is £1,081.50 better off, about £1,082 as the calculator shows. Every £1 spent returned about 36p of profit, because 3 times 0.4535 is 1.36 and the first £1 of that repays the spend.
Drop the ROAS to 2x and the same arithmetic turns negative: £6,000 of revenue gives £2,721 of contribution against £3,000 of spend, a loss of £279 a month. That is why a "good" ROAS depends entirely on the margin behind it.
Break Even and Target ROAS at Different Margins
The table shows how quickly the numbers move with margin. A store on a 25% contribution margin needs 4x just to stand still and 6.67x to keep 10% after ads, while a 60% margin store breaks even at 1.67x.
| Contribution margin | Break even ROAS | Target ROAS for 10% net margin |
|---|---|---|
| 20% | 5.00x | 10.00x |
| 25% | 4.00x | 6.67x |
| 30% | 3.33x | 5.00x |
| 40% | 2.50x | 3.33x |
| 45.35% (worked example) | 2.21x | 2.83x |
| 50% | 2.00x | 2.50x |
| 60% | 1.67x | 2.00x |
| 70% | 1.43x | 1.67x |
The practical lesson is that margin work and ad work are the same job. Lifting the contribution margin from 45.35% to 50%, through a price change, cheaper packaging or a better carrier rate, lowers break even from 2.21x to 2x and the target from 2.83x to 2.5x without touching a single campaign.
Put Spend and Revenue on the Same Basis
Most ROAS arguments between a store and its ad platform come from comparing figures measured in different ways. Four checks sort out almost all of them.
- VAT. In our experience Google Ads usually receives the VAT inclusive checkout total from UK stores, while your margin lives in the ex VAT figure. A 400% ROAS in Google is about 333% once the 20% VAT comes out. Place one real order and compare the Shopify total, the ex VAT revenue and the value that arrives in Google Ads, then use the box under the calculator if your figure includes VAT.
- Attribution. Google counts a sale if the click came within its conversion window, 30 days by default, and credits it to the day of the click. Shopify's marketing reports use a last click model by default. The two will rarely agree, so pick one basis and keep it for spend, revenue and the target. Our guide explains why Shopify and Google Ads disagree in more detail.
- Period. Spend in the last week of a month often produces orders in the first week of the next. Compare whole months or a trailing 30 days rather than a few days at a time.
- Returns and repeat buyers. Ad platforms rarely remove refunded orders from reported revenue on their own, so build returns into the per order cost instead. Revenue from existing customers who would have bought anyway flatters ROAS too, which is why customer lifetime value matters as much as the first order.
What to Do If You Are Below Break Even
A ROAS under break even is a diagnosis, not a verdict on paid advertising. Work through these in order before cutting the budget.
- Check the tracking before anything else. Most of the Google Ads problems we inherit are not bidding problems, and this year the most common is broken conversion tracking. Duplicate purchase tags, missing values and renewals counted as new sales all distort the ROAS you are judging. Our Google Ads audit checklist starts there.
- Remove the waste. When we audit a new client's advertising, an average of 30% of spend is wasted on search terms, locations, placements and products that never convert. Removing it raises ROAS without a single new sale.
- Fix the feed and the product pages. Disapproved products, poor titles and slow pages waste clicks you have already paid for. See our guide to Google Merchant Centre for Shopify.
- Raise contribution per order. Bundles, free delivery thresholds and cheaper packaging lift the £45.35 in the example, which lowers both the break even and the target at once.
- Separate brand, non brand and Performance Max. A blended ROAS can hide a loss making channel behind a profitable brand campaign. Our Performance Max guide shows how to structure it around margins.
- Then set the bid target. Once the data is clean, enter the target from this calculator as a percentage in Google Ads. Google requires conversion values and at least 15 conversions in the past 30 days for Search and Shopping campaigns before Target ROAS bidding can be applied.
Why Matters Perspective
We built this calculator because the first question new clients ask is whether their ROAS is any good, and the honest answer is always "compared with what?". Across the accounts we manage, we work to a floor of at least 2x, but that floor is a starting position rather than a benchmark, and it only makes sense for stores with a contribution margin near 50%. A client on a 30% margin needs 3.33x before a single pound of profit appears, and we would rather they knew that before the campaigns went live.
The numbers usually move faster than people expect once the basics are fixed. When we audit a new client's advertising, an average of 30% of spend is wasted, and across the accounts we manage, cost per acquisition falls by an average of 45% in the first 90 days. That is the gap between break even and target closing from both sides: less waste in the spend and more contribution from each order.
If you would like a second pair of eyes on your account, the free Google Ads review below is a written look at tracking, waste and targets against your real margins, with no obligation. Our Google Ads management starts from £650 a month plus VAT, our pricing is published, retainer clients are billed one month in arrears and are never tied into long contracts, and the ad account always stays yours. Why Matters is a Shopify Select partner with Verified Skills across development and marketing.
Frequently Asked Questions
What is a good ROAS for ecommerce?
There is no universal good ROAS, because the same revenue covers very different costs from one store to the next. A good ROAS is one that sits above your break even ROAS by enough to leave the margin you want. A store with a 45.35% contribution margin breaks even at 2.21x, so 3x is healthy for it, while a store with a 25% margin loses money at anything under 4x. Work out your own break even first, then judge your ROAS against it.
How do I calculate ROAS?
Divide the revenue your ads produced by what you spent on them. £9,000 of revenue from £3,000 of ad spend is a ROAS of 3, written as 3x or, in Google Ads, as 300%. Use revenue excluding VAT and the same period and attribution window for both figures, or the result will flatter or punish the ads for the wrong reasons.
What is break even ROAS?
Break even ROAS is the return at which the ads cover their own cost and nothing more. It is 1 divided by your contribution margin, where contribution margin is the share of an order left after product cost, delivery, packaging, returns and payment fees, all excluding VAT. If £45.35 of every £100 order is left, the margin is 45.35% and break even is 1 divided by 0.4535, which is 2.21x.
Should ROAS be calculated with or without VAT?
Without. The 20% VAT on a UK order belongs to HMRC, so it cannot pay for ads or product. Google Ads usually receives the VAT inclusive checkout total, so a 400% ROAS in Google is about 333% on the ex VAT basis. The calculator has a box to tick if your revenue figure includes VAT, and it divides the figure by 1.2 before working anything out.
Does the calculator include agency or management fees?
Not unless you add them. If you want an all in figure, add the management fee to the ad spend. With a £650 monthly fee on top of £3,000 of ad spend, £9,000 of revenue gives a ROAS of 2.47x rather than 3x, and the break even and target figures stay the same, so the fee simply narrows the gap.
What is the difference between ROAS and POAS?
ROAS compares revenue with ad spend. POAS, profit on ad spend, compares the contribution those orders produced with the same spend. In the worked example, 90 orders at £45.35 of contribution each give £4,081.50, which is a POAS of 1.36 on £3,000 of spend. The calculator shows the same idea as the result after ads, which is that contribution less the spend.
How many conversions does Google Ads need before I can use a Target ROAS bid strategy?
Google says Search and Shopping campaigns need at least 15 conversions in the past 30 days at the conversion tracking level, and that conversion values must be set before Target ROAS can be applied. Google expects the target as a percentage, so a 2.83x target is entered as 283%.
Final Thoughts
ROAS on its own tells you how much revenue your ads produced. Break even ROAS tells you whether that revenue was worth having, and target ROAS tells you whether the business is growing. The calculator at the top of this page gives you all three in a few seconds, as long as the figures you type in are on the same basis.
Use it before you brief an agency, before you accept a new bid target and whenever your costs change. A new carrier contract or a price rise moves your break even just as surely as a campaign change does.
If the result is red, or you are not sure the revenue figure can be trusted, send us the numbers through the form below or email info@whymatters.co.uk and we will come back to you within 24 hours.
Related Articles
- What Is a Good ROAS for Ecommerce? Find Your Break Even
- How Much Does a PPC Agency Cost in the UK?
- Google Ads Audit Checklist for Ecommerce Stores
- Performance Max for Ecommerce: Structure It Around Margins
- Customer Lifetime Value for Shopify Stores: How to Calculate and Grow It
- Shopify Payments UK: Fees, Payouts and How It Works
- Top 10 Google Ads Agencies in the UK: A Curated Guide
- Top 10 PPC Marketing Agencies in the UK: A Curated Guide

Ayo is the founder of Why Matters and Head of Marketing. With over 20 years of experience in ecommerce, digital marketing and commercial growth, he has helped hundreds of Shopify brands build, launch and scale their online stores. Why Matters, a Shopify agency based in Brighton, is a Shopify Select partner and a Klaviyo, Recharge, Awin, Meta and TikTok partner.About AyoConnect on LinkedIn
Get your free Google Ads review
Tell us a little about your store and we'll get back to you within 24 hours.